That nice Mr Cameron tells us he’s saved Britain from bankruptcy, the economy is improving under his skilful management, more people than ever before are in work and so we should all be cracking open the Bolly and voting for him in 2015 so that he can “finish the job”.
But that nice Mr Miliband claims that ever more people are being driven into poverty and having to use food banks, that there’s a “cost of living crisis” and that the recovery is a “recovery for the rich”. If we vote for him, he’ll tax and tax and tax the rich more to make society fairer.
So, who is telling the truth?
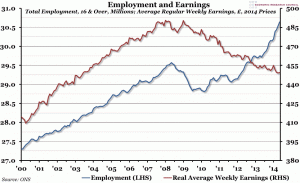
This simple chart probably gives the best picture of what is actually happening in Britain (click to see more clearly)
Between 2000 and 2008 in the Brown Boom, the numbers in employment went up from around 27.3 million to about 29.5 million (blue line and left hand scale on the graph). At the same time, average weekly earnings (red line and�right hand scale on the graph)�increased from around �411 a week to �486 a week. Then came�Gordon Brown’s�2008 bust. Employment dipped from 29.5 million to 28.9 million before heading upwards again towards over 30.5 million today. But, at the same time, average real wages (adjusted for inflation) have continued to fall from �486 a week to around �450 a week.
So, the number of people�in work�is increasing significantly as�Dodgy Dave�claims. But wages are falling quite dramatically as Red Ed claims.
Then you have to remember that those on higher earnings (CEOs, managers, top bureaucrats, doctors�etc) have been getting massive salary increases almost every year. For example, in the period 2000 to 2014, the value of Britain’s top 100 companies fell by over 20% in real terms, but the average remuneration package of the CEOs shot up from around �1.5m to over��4m. Once you take out the top earners, it seems�the plight of those lower down the wage scale has been seriously affected by stagnant earnings and rising prices.
I thought this chart might be useful to readers as they hear our rulers constantly bickering like children in a school playground. Meanwhile, none of our rulers ever mentions the mammoth in the room – our ever-increasing national debt http://www.nationaldebtclock.co.uk/
“Hi ho hi ho it’s into debt we go, we�spend away�but who will pay? Hi ho hi ho hi ho hi ho.”


http://www.nationaldebtclock.co.uk/
Version 2
NB issues of productivity
see: http://www.ons.gov.uk/ons/rel/elmr/an-examination-of-falling-real-wages/2010-to-2013/art-an-examination-of-falling-real-wages.html
which raises questions about management and the costs of management, areas well covered in your blog and books.