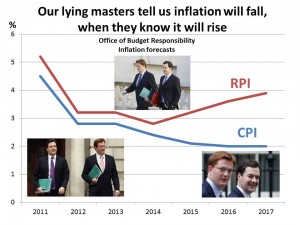
I’ve written before about how our Government always talks about CPI inflation and hopes we forget about RPI – because CPI (which doesn’t include some things like housing, council tax, road tax and TV licence) is almost always lower than RPI. So, when telling us how high inflation is, the government uses the lower CPI to make it look like they are in control of the economy.
The Government uses the lower CPI for the indexation of most tax rates, allowances and thresholds, in order to take more money from us. However, even though the Government claims RPI is no longer relevant, it uses the much higher RPI for things like student loan repayments and for index-linking pensions of Bank of England staff, senior civil servants and politicians so as to take more money from us for our rulers
But the Government has also devised some extremely clever ways of fiddling the CPI figures so even these don’t tell us anything like the truth about the real level of inflation. The three main tricks are ‘Hedonic Quality Modelling’, ‘Substitution’ and ‘Geometric Means’ (please stay with me as this is quite important)
Hedonic Quality Modelling This allows statisticians to claim the prices of some things have fallen if those things�are improved. For example, if broadband speeds increase while we pay the same each month, statisticians will conclude that the price has actually fallen even though we may get no advantage from faster speeds as most of the increased speed is used up bombarding us with ever more useless all-singing all-dancing ads. Or if the memory size of the average computer increases while prices remain stable, statisticians will decide that the price has actually fallen even though we get no increased ‘utility’ as programmes and apps become increasingly complex and memory-intensive.
Substitution Statisticians replace things that are rising rapidly in the CPI figures with things that have not risen. For example, if steak or salmon go up in price, statisticians will reduce their weighting in the CPI index or even take them out of the index altogether and replace them with something cheaper like chicken. The reasoning is that this is the way consumers behave in the real world. So, instead of measuring a constant standard of living, CPI is actually measuring a declining standard of living where rising prices are forcing consumers into making second, third and even fourth choices because they can no longer afford to buy the things they really want and which they used to buy.
Geometric means I don’t understand this, but apparently by using a ‘geometric mean’ rather than an ‘arithmetic mean’ this knocks at least another 1% off the supposed CPI inflation level.
I suspect that CPI inflation is really running at around 5% and RPI is in the region of 7%. (Pete Comley, author of the free ebook on Amazon about investing -�MONKEY WITH A PIN – will have calculated the real inflation levels by the autumn).
Why is this important? The Government has 4 main ways of taking our money – direct taxes, indirect taxes, stealth taxes (not raising tax thresholds) and inflation. The one that nobody really notices is inflation. If my figures are anywhere near correct, then your savings, investments and pensions�will look like they keep going up in value making you feel pretty good, but will actually have lost at least 20% of their buying power in the next 5 years and close to 40% within 10 years. This is happening and almost nobody in Britain realises it.
(And talking about prices, remember my latest book DON’T BUY IT! is available from Amazon as an ebook at only �0.99p for a very limited period. Now is the time to get a copy before the promotion ends http://www.amazon.co.uk/Dont-Buy-It-tricks-salespeople-ebook/dp/B00J0Y59GC/ref=tmm_kin_title_0�)


I never believe anything the government says. I’ve held that opinion for around 17 years.
When you include housing – which, as everybody knows is in a bubble – guess what happens to the government’s CPI figure? Yep, it goes…DOWN!