If you ever read the Money section of your weekend newspaper, you’ll see article after article about our savings in which the journalist writes something like “assuming growth of six per cent a year” or “assuming growth of seven per cent a year”.
Or if you’re saving for a pension, you’ll get three projections of how much money you’ll have by retirement – usually there will be a ‘low’ growth rate of 5%, a ‘medium’ one of 7% and a ‘high’ rate of 9%. Though, from this month pension companies will be forced to reduce these rates to: low – 2.5%, medium – 5% and high – 8%.
There’s only one problem – apart from the new low rate of 2.5% for pensions, all the other projected growth rates used by sloppy journalists and pension fund managers are pure fantasy. Well, not total fantasy – they did happen once (yes just once) in the last 300 years.
This may be the most important chart any saver, unit trust holder or person putting money in a pension will ever see. And it’s a chart no financial adviser, no newspaper financial journalist and no pension company will ever show you.
What this chart does is split the last 300 years into 20-year segments and show how often different levels of real (adjusted for inflation) growth have been achieved (click to see more clearly)
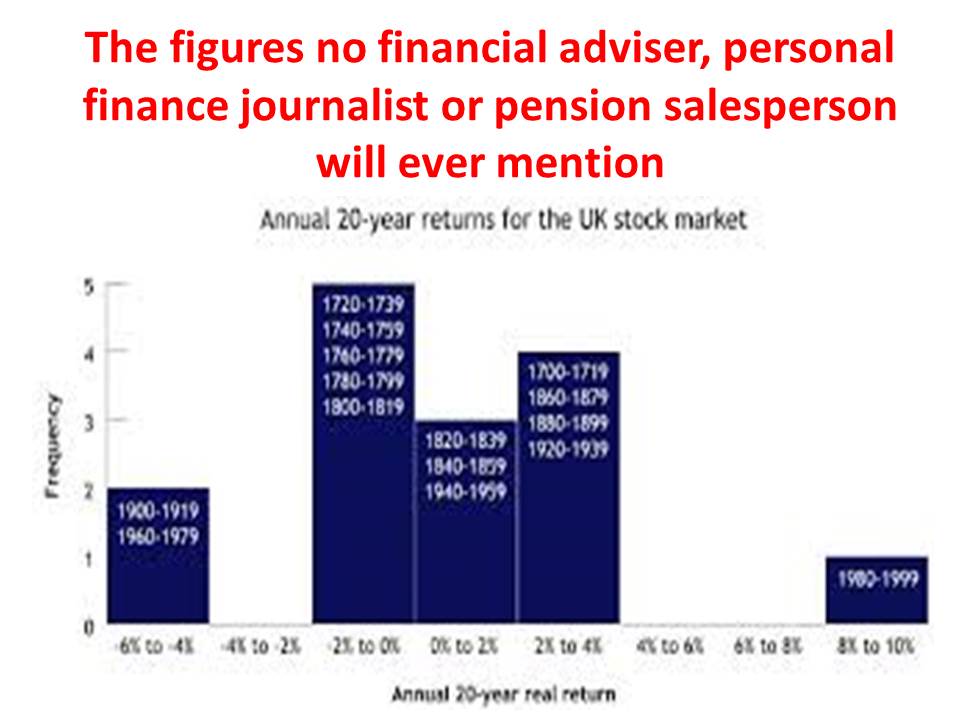
So, for example, growth of 2% to 4% was achieved four times; 0% to 2% three times; -2% to 0% five times and -6% to -4% twice. Growth above 4% a year was only achieved once – in the 1980s and 1990s.
(These figures don’t include dividends, so you can add on say 2% to 2.5% per year for these. But even so, the growth�rates of 5% to 6% and even 7% a year commonly used by journalists and financial services insiders are pure fantasy. Moreover, if you have savings in unit trusts or pensions, you’ll probably be paying total fees of 2% to 3% a year. So, that will eat up most if not all your dividends.)
Why were the 1980s and 1990s so exceptional? The main reason�is probably the baby-boomers. The 1980s and 1990s were the time when the baby-boomers were at their maximum earning and savings potential and were putting their savings into things like shares, unit trusts and pensions.
But as the baby-boomers retire and start to withdraw their savings to live off, it’s hard to see where new demand for shares will come from. After all, the next generation (Generation Debt) will be so burdened by paying off large mortgages on over-inflated house prices and repaying student loans that they won’t have much left to save. So it’s more than unlikely we’ll ever see ever see returns like the 1980s and 1990s again in our lifetimes.
What does this mean for us? Two things:
1. Next time some self-interested journalist writes about “assuming growth of six per cent” or your pension company sends you projections of 5% or 8% or whatever, please remember this chart. Such figures are pure fantasy.
2. If you are paying more than say 1% in management charges for your investments or pension, then the only person getting rich is your unit trust or pension fund manager.
If it’s of interest to any reader, I do a talk called HOW TO SAVE A FORTUNE. More details here http://www.howtoacademy.com/money/save-a-fortune-a-financial-masterclass-in-savings-pensions-and-other-financial-products-2309?fromcat=36�I’m looking for speaking opportunities. Ideally it should be to the management teams of companies or to clubs and similar organisations. I believe that anyone attending such a talk will be able to save themselves and their families anywhere from �5,000 to �50,000 from getting�a better�understanding of how financial services sell their products to us. If this could be of interest, please get in touch.


Leave a Reply